2021 Trends in HERS-Rated Homes
There were more than 240,000 homes HERS rated in Ekotrope RATER in 2021! That’s a lot of data! In this article I’ll share some of the insights I thought were interesting that I’ve found using Ekotrope’s data visualization tools.
Where are Ekotrope HERS ratings being done?
The state with the highest number of completed HERS Ratings was Texas - almost 3 times more than second-place North Carolina.


Unsurprisingly, 4 Texas metropolitan areas were in the Top 15 largest HERS Markets for Ekotrope. A few metro-areas that outperform their size based on the number of home construction starts (using the most recent US Census Data) are Indianapolis, which is just the 30th largest housing market but 11th on our Top 15 list, Raleigh, San Antonio, Las Vegas, Denver, and Boston (woohoo… Ekotrope’s home city just made the list!).

Which States had the best HERS Rating Performance?
For states that completed more than 2,000 ratings, Minnesota has the best average HERS Index of 50! A few states had even better HERS Index averages - Oregon, California, and Maine all had average HERS Indexes of less than 40 – but they completed fewer than 1,000 ratings and are overly susceptible outliers.
If we look at the 10,000 best-performing homes, Colorado, Minnesota, and Massachusetts are represented disproportionately.

Which States had the best 45L Performance?
45L Tax Credit is a major motivator for builders to pursue a HERS Rating - three states (again only considering states with greater than 2,000 ratings) seem to utilize this strategy very effectively. Minnesota, Iowa, and Maryland all have greater than 60% of their HERS Ratings pass the 45L Tax Credit. Minnesota had a whopping 79% of homes pass 45L - using Scenario Modeling we found that if MN builders averaged 1.5 ACH50 they would see that increase to 85% of HERS Ratings passing 45L. That 1.5 ACH50 specification is worth $1.4 million in tax credits. In total, though, Texas still sees more homes pass 45L than second place, Minnesota.


What are typical specifications for homes?
Air Sealing Ducts and Envelope:
Across the country the average duct leakage to outside results show a trend towards the adoption of more current codes. The current average is 4.63 cfm25 / 100 sq.ft. You can see in our data clear spikes in frequency right around code thresholds 🤔. If we look beyond that and look at the states with more than 2,000 ratings you find the “I” neighbors - Iowa and Illinois with the best and worst duct leakage (sorry Indiana!). After all, Chicago is the Windy City.

Homes in the Midwest look to be very well built across the board - Minnesota leads the country in average envelope leakage (again, considering only states with more than 2,000 ratings). Their average of 1.99 ACH 50 just surpasses Iowa’s.
Walls:
Fiberglass batts are by far the most popular wall insulation material - spray foam represents a fraction of wall insulation materials in HERS Rated homes. These rates look to be staying consistent across the entire year as well. If there is a trend, fiberglass batts are gaining a slight market share towards the end of 2021.
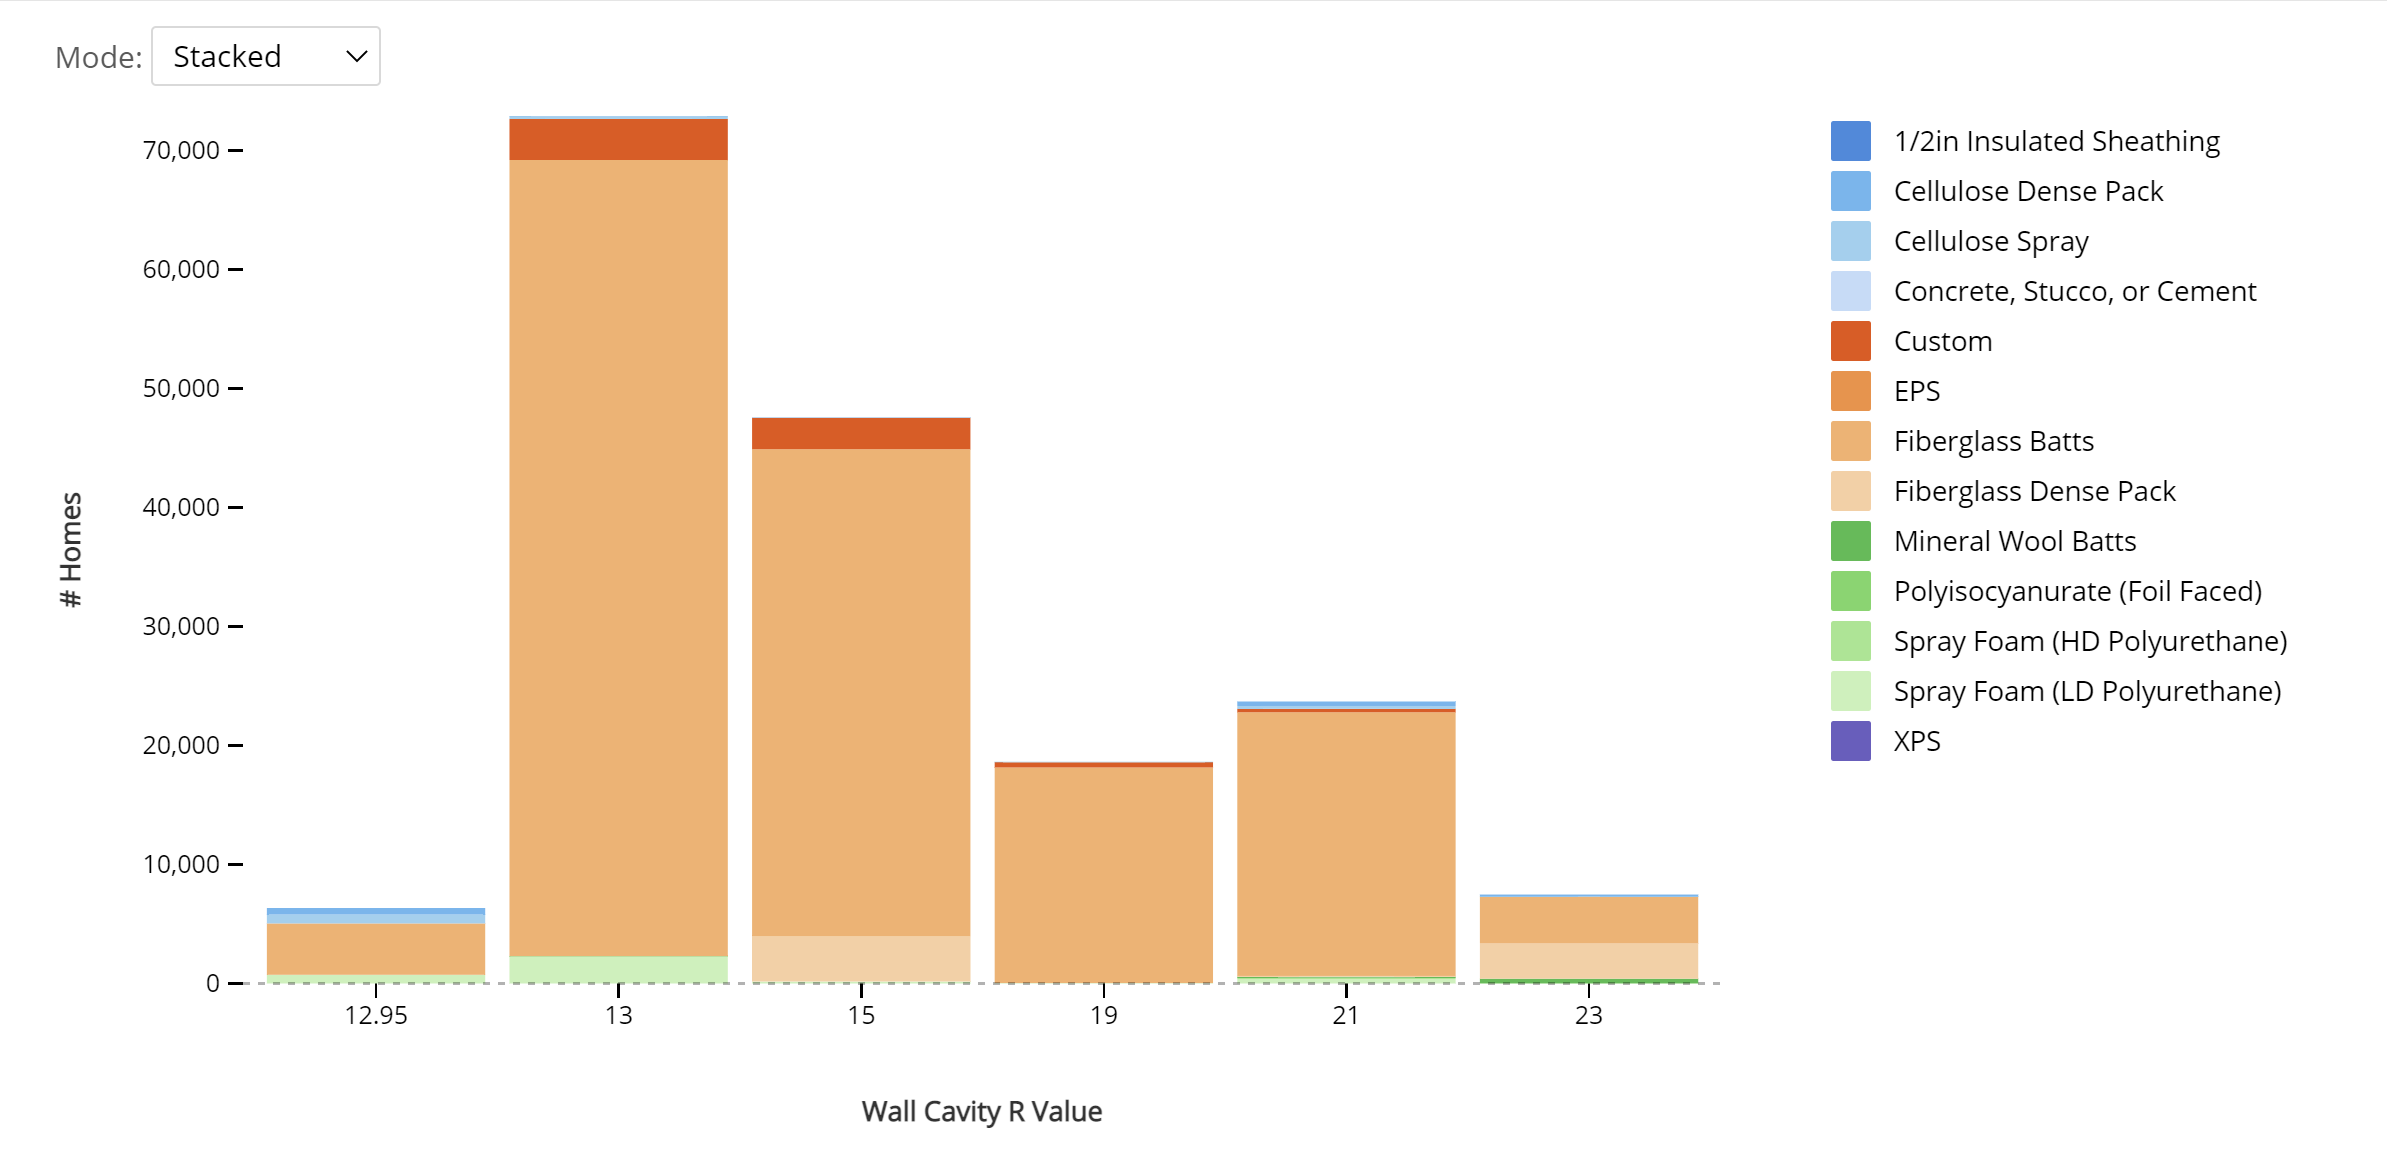
Wall Insulation material is remarkably consistent across all wall types as well. High-performing walls (R-19, -21, -23) use fiberglass batts just as much as the standard R-13 cavity wall - which is still the most common wall in Ekotrope HERS Ratings. These material usage trends are very consistent regardless of 45L Compliance, state, stud type, and continuous insulation usage. However, continuous insulation is popular on R-13 walls with 40% of those walls including some form of continuous insulation.


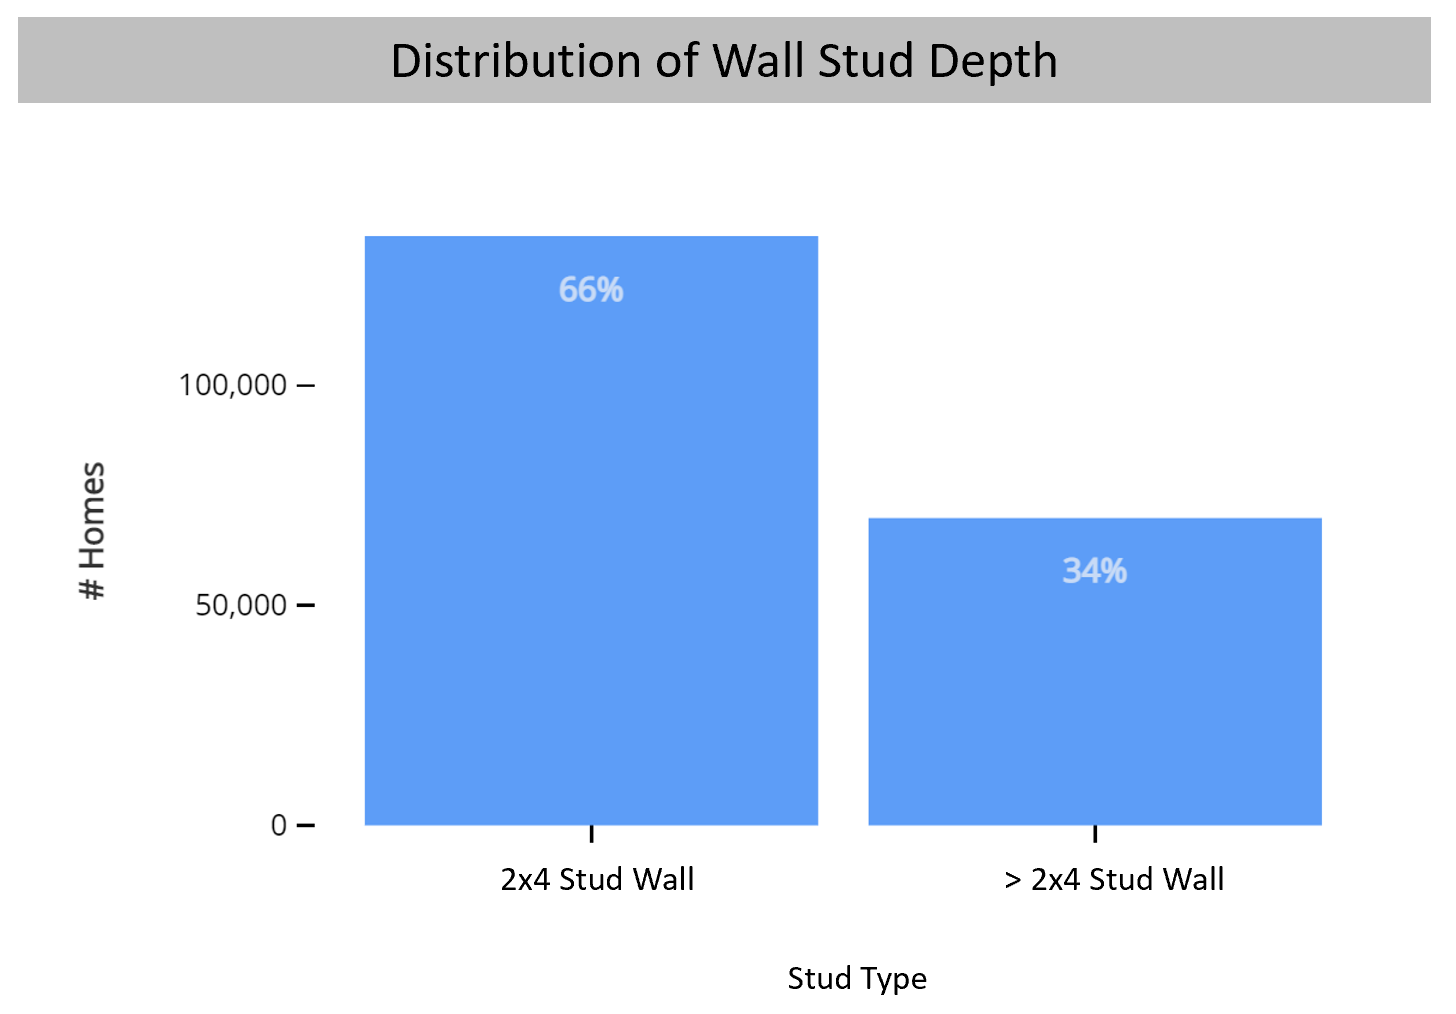
Over 30% of homes now use a stud that is larger than 2x4 - likely to allow for more insulation. Predictably, these homes are generally concentrated in Northern Climate Zones. There are some anomalies like Arkansas, New York, and Iowa with a low 2x4 wall usage compared to their climatic neighbors.

Ceilings:
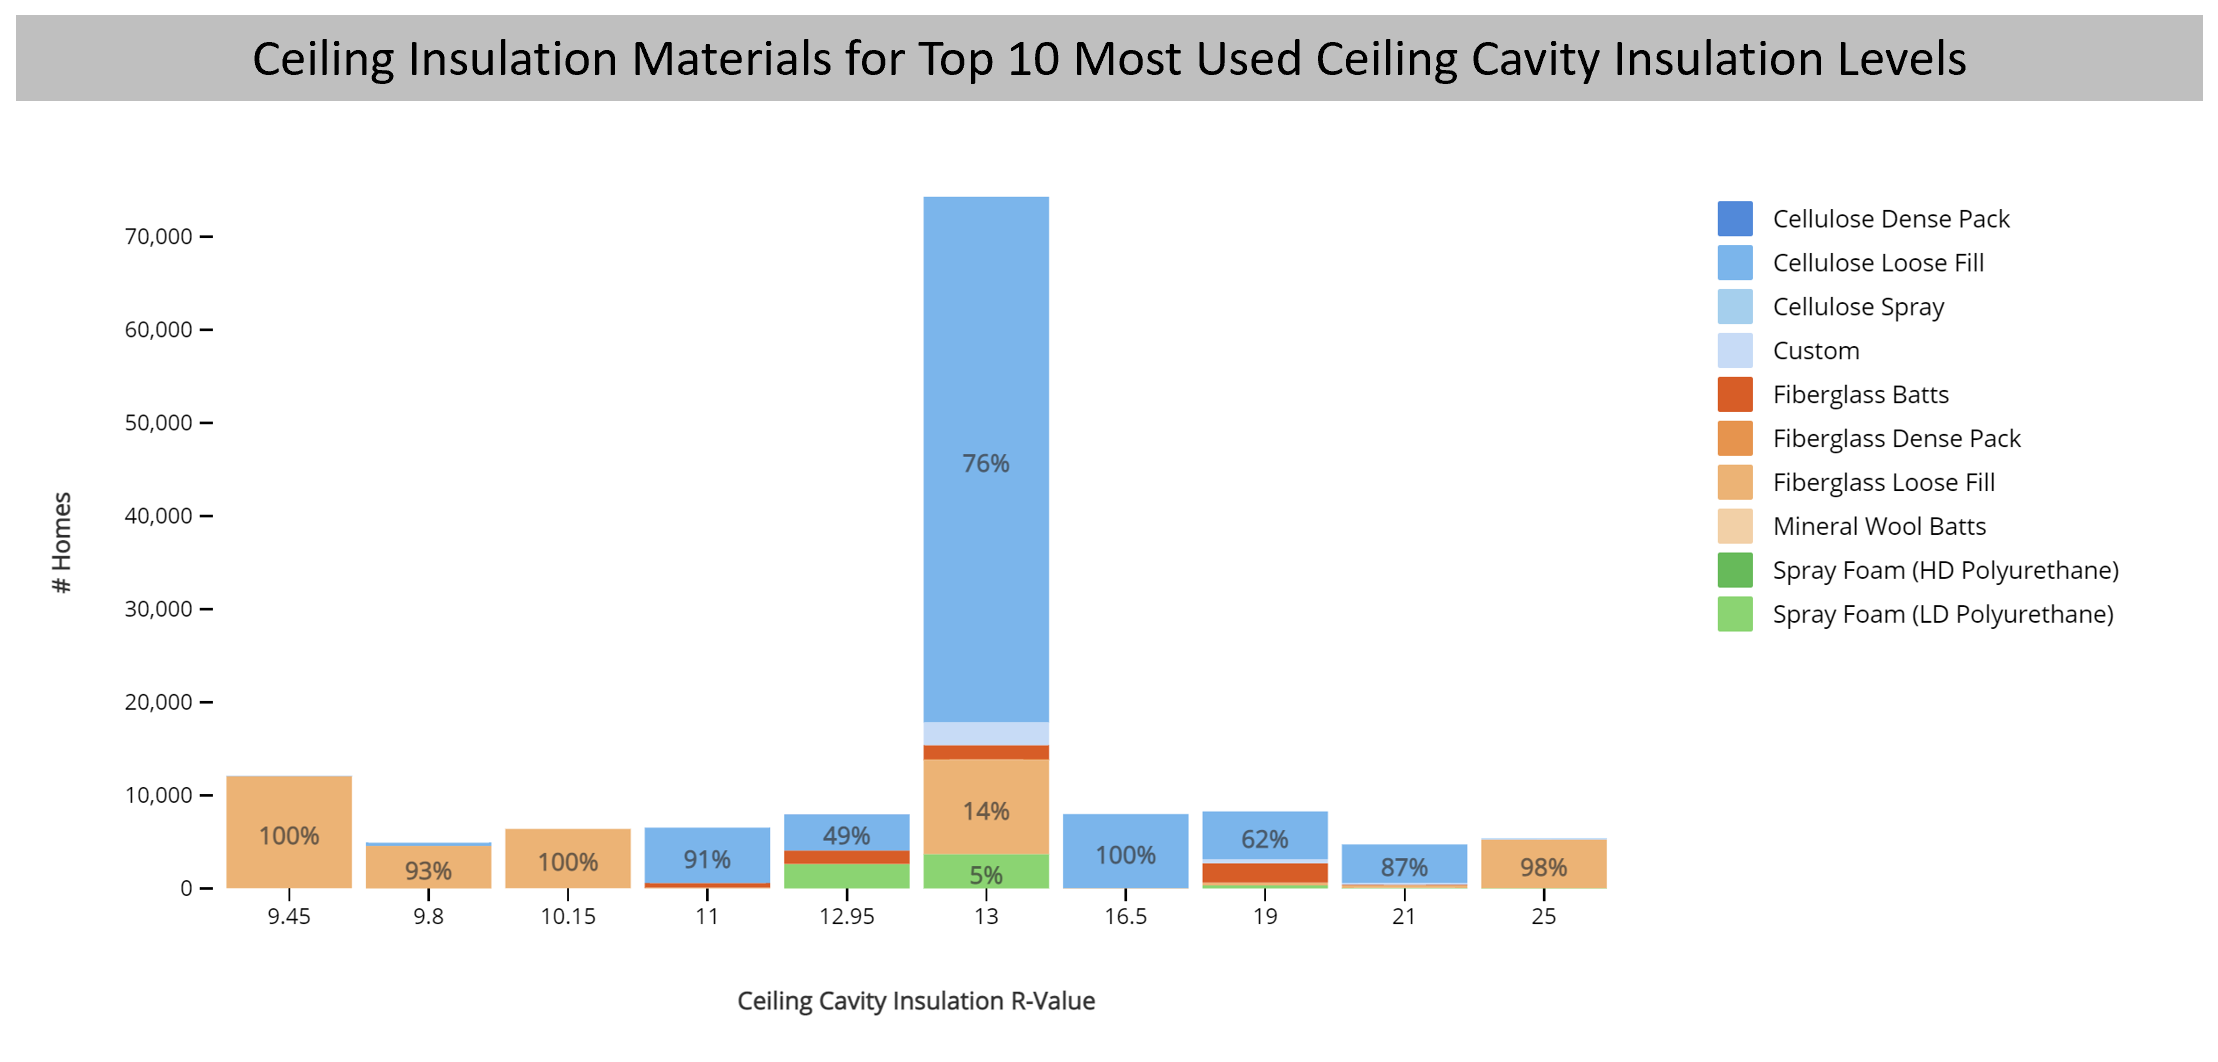
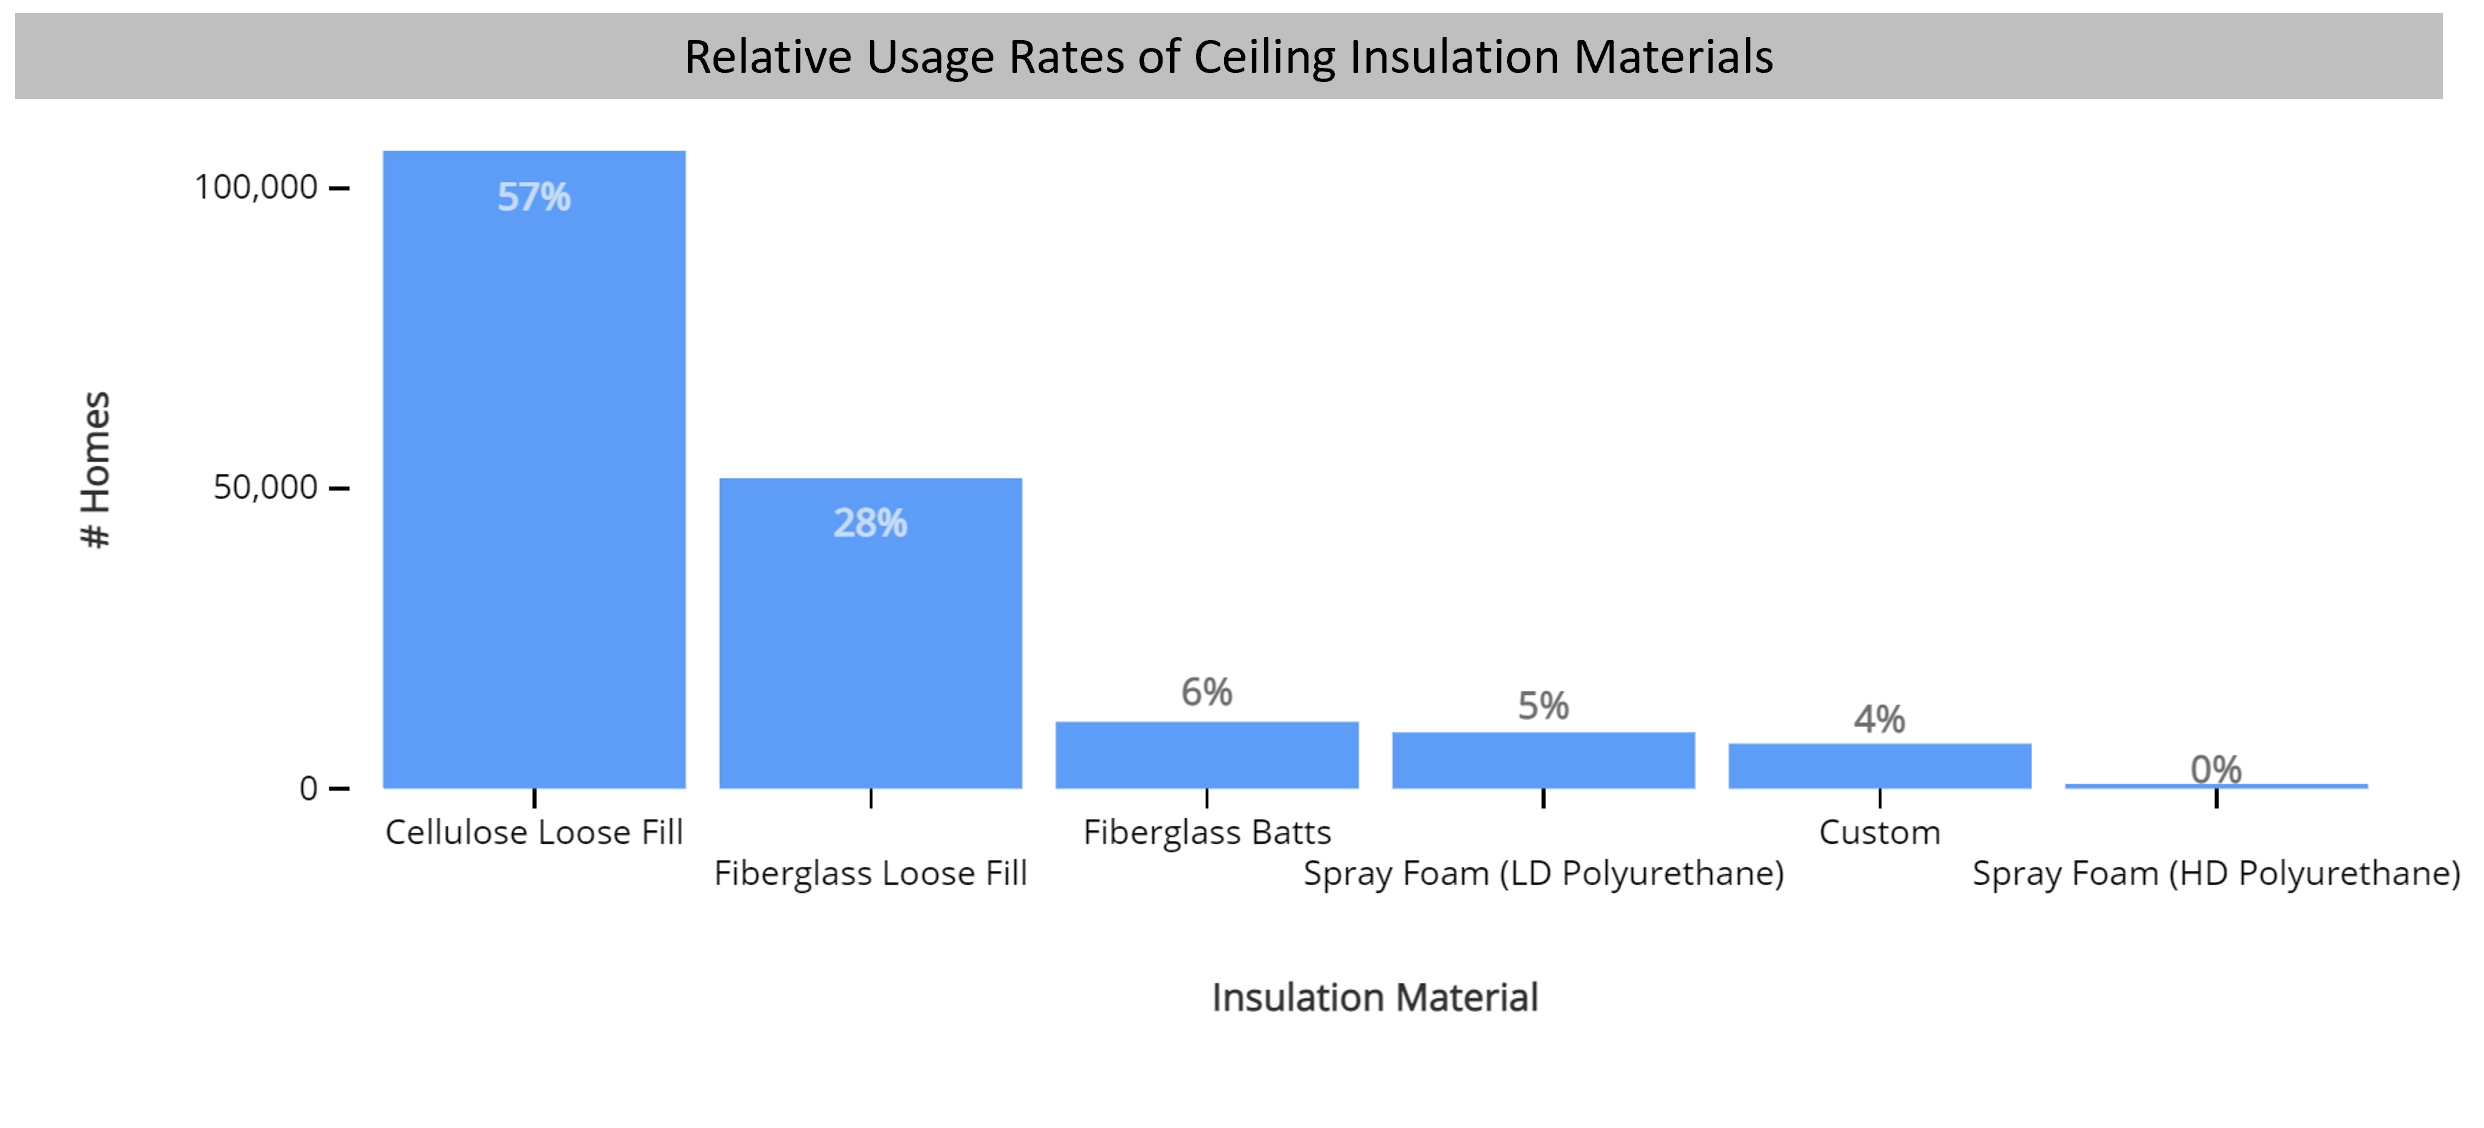
A little over 80% of homes use loose-fill ceiling insulation. About the same number of homes use fiberglass batts as spray foam insulation for attic insulation. The average home has an R-14 cavity and R-22 continuous insulation for a U-Factor of 0.04. Realistically, though, R-13 cellulose loose-fill cavity insulation is the most used attic insulation application.
In short, 2021 was a successful year for the rating industry, despite the material shortages and pandemic accommodations. These data are just a peek at the insights and trends that can be found in HERS Rating data. We are excited to investigate these trends with our new data visualization and dashboard tool that we are piloting with a few users. Tell us the type of stats you’d like to see and we’ll do a follow-up blog with those included.
One, final thought. On average the ceiling, floor, and wall U-Factors for homes that pass 45L Tax credit are 0.1 better than homes that do not pass 45L.
